To begin creating a report selecting Reporting and Reports from the side menu. From there click on 'Add New Custom Report' as shown below.

The report editor will be displayed with an empty canvas where the report can be created.
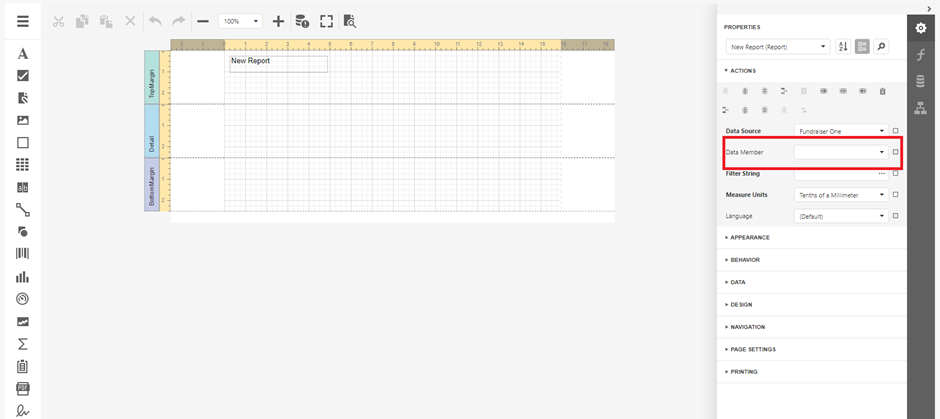
From the right-hand panel select the drop-down menu of ‘Data Member’ and select the table you will be using for the report. For example, ‘Contacts’ for the contact summary report.
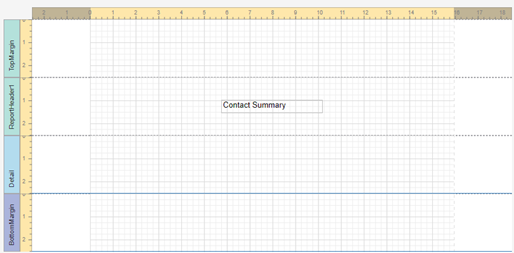
Select from the report components ‘Report header’ to add to the report, this way we can add a title to our report.
Add a label from the left-hand menu, choosing the second option under the menu button, drag this into our report header section of our report.

Double click the newly added label and add the name of our example report ‘Contact Summary’, of course you can choose to name this anything.
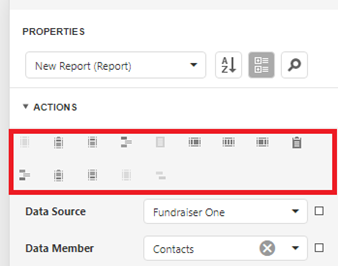
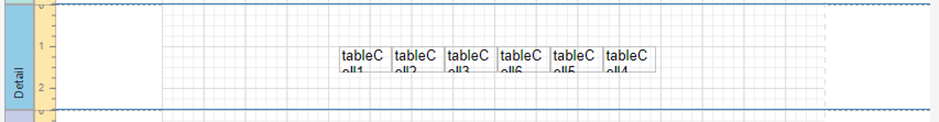
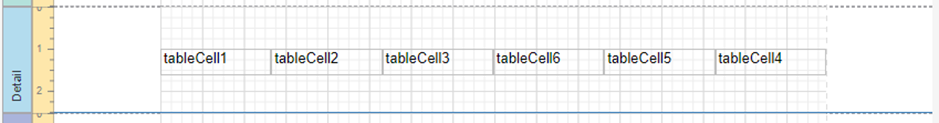
Next, we want to add a table to the ‘Detail’ section. We want the table to have as many cells as we want fields. For contact summary: ID, Title, Name, address, phone and email, so 6 cells in our table. Selecting the whole Table gives us an option to ‘distribute columns evenly’ (Second from the right).

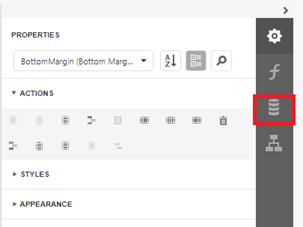
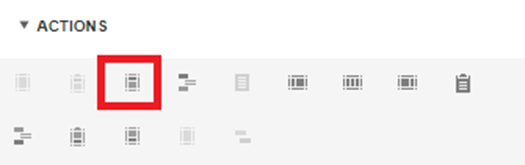
To add new cells, click on a cell in the already existing table, and select one of these options.

Adds a row above.
Adds a row below.
Deletes current row.
Adds a cell to the left.
Deletes current cell.
Adds a column to the left.
Adds a column to the right.
Deletes current column.
Fits the cells text to either grow or shrink to fill the whole cell.
Select the whole text box, and let’s stretch it to the bounds of our page on both sides.
Next, we need to shrink the detail section to fit around the text-box perfectly, first, select the text-box and drag it to the top of detail, next, click on the word detail, and drag the detail section upward until it reaches the text-box, so it fits like this.

Next fill these text-boxes, with our data. Select the ‘field list’ tab, shown below.
Click the arrow next to the data source name and select 'FundraiserOne'. From the drop-down menu select the data member you selected in previous set in this example we selected 'Contacts'.
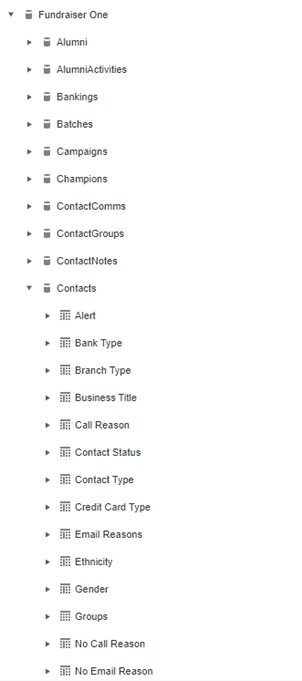
Follow the table down, until you find the fields you want and drag and drop them into the positions you want in the table we already created.

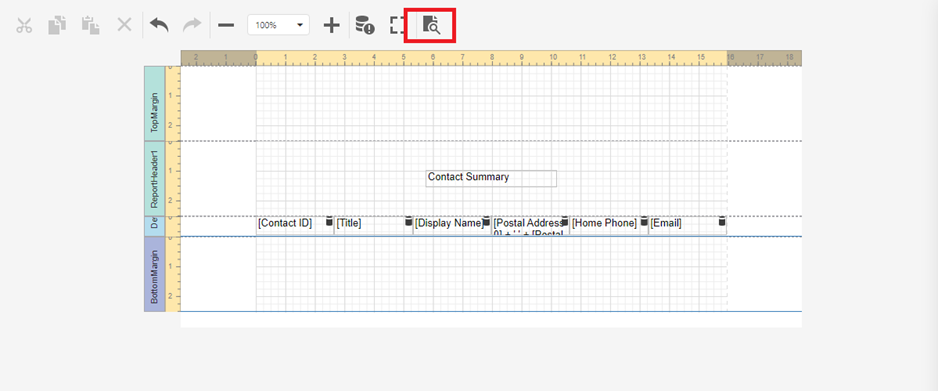
Tip: For Address or similar situations fields can be added together using '+'. For Example, Address 0 + Address 3 + Suburb + City + Postcode.
Click on preview below to view the report in progress.
This is a very basic looking report so far, lets change the page to landscape so all our fields can fit on the page and resize our cells to a better size.
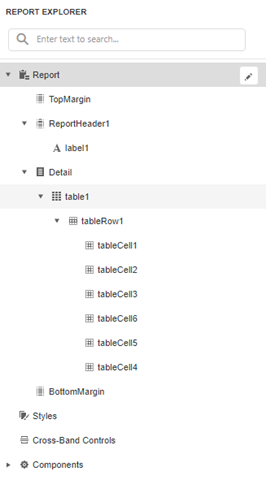
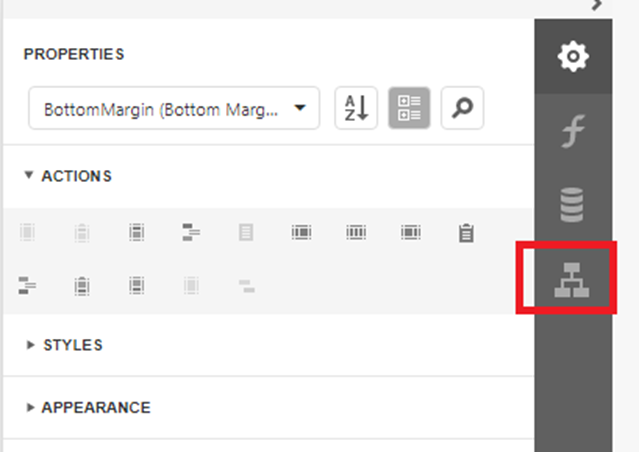
To change the page orientation, select the ‘Report Explorer’ tab. Select ‘Report’ from there go back to our main ‘settings’ tab, and scroll down until ‘Page Settings’ drop-down that menu. This is where pages options can be found, including page orientation.
Once the page is rotated stretch the table out to fit the area.
Now add the field titles and be done with this, drag and drop another table into the ‘page header’ section, create as many cells required.
Double click the cells to rename them and add the corresponding name into the space provided.
The report is now complete and it can be edited and updated at any time required. Using the Report Wizard is easier but there is more flexibility using this process.